Universal Request Analyzer
DevTools network inspection with persistent SQLite storage, historical analytics, and performance tracking. Never lose your debugging data again.
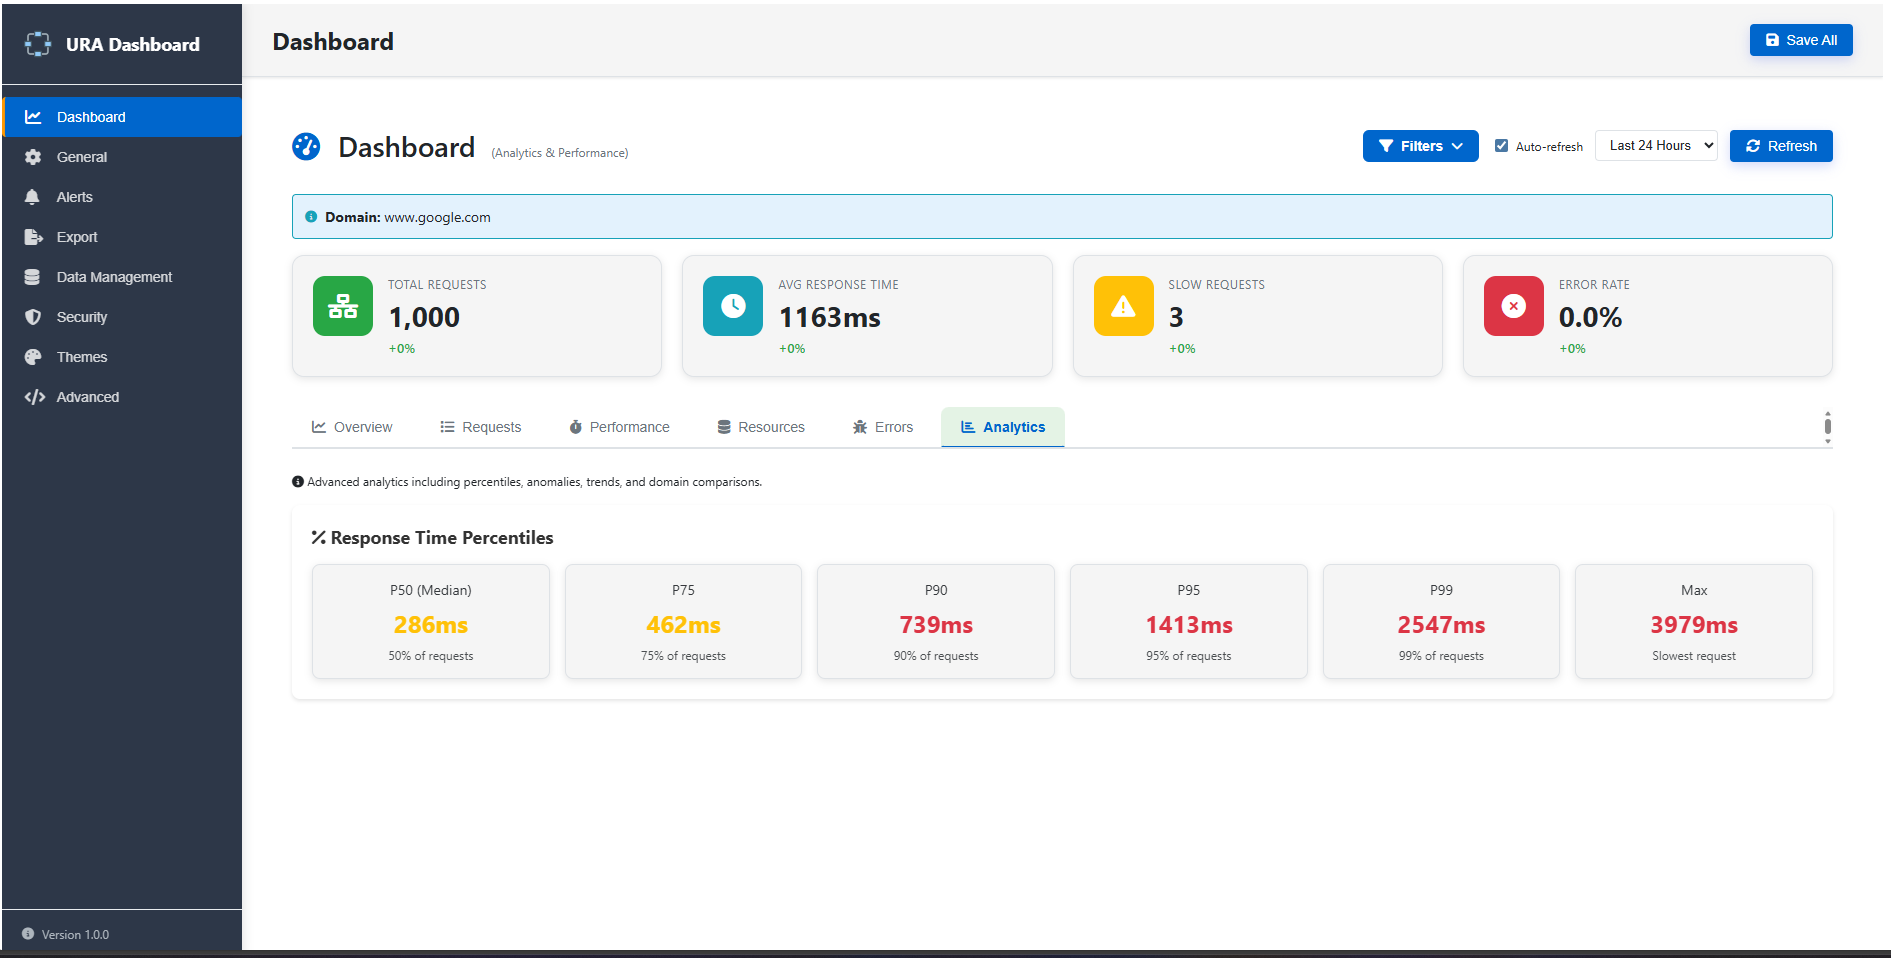
📊 Analytics Dashboard
Track API performance over time
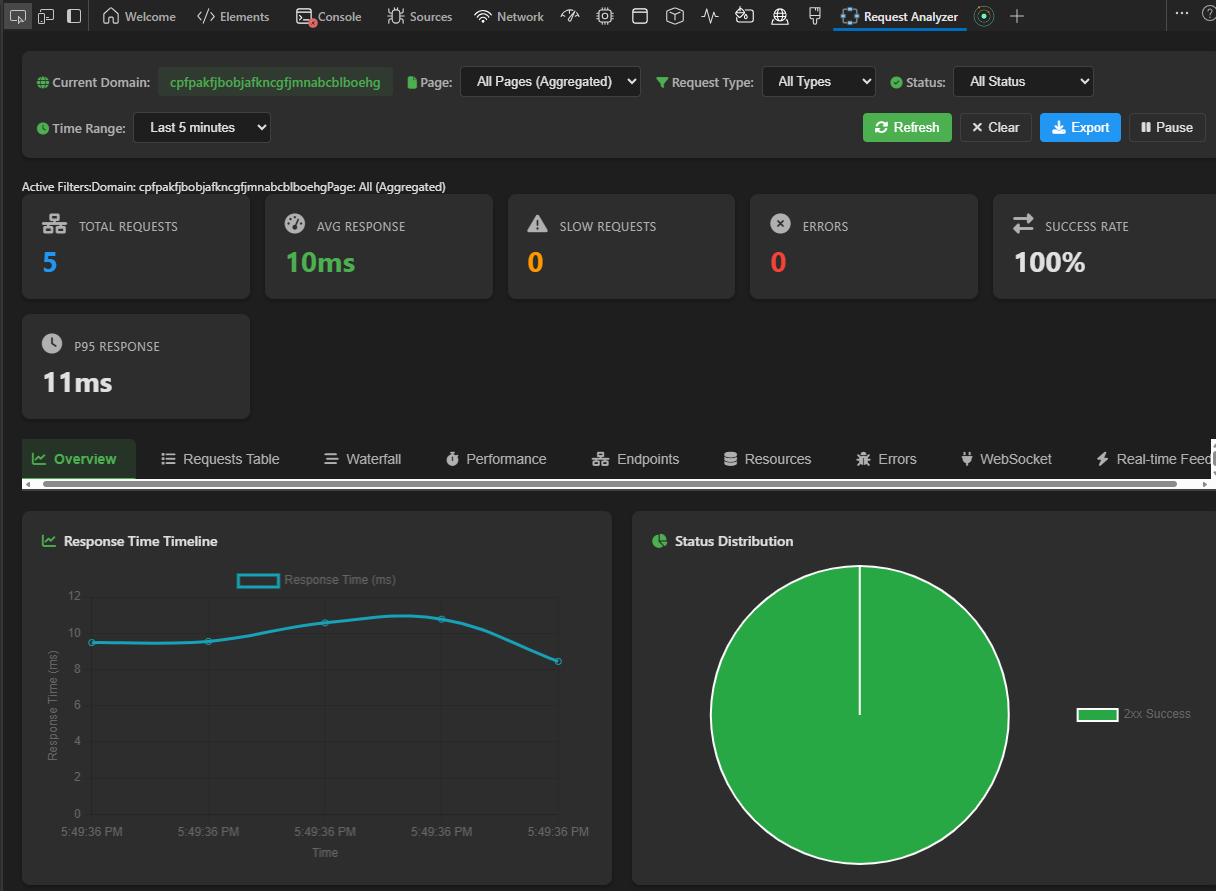
⚡ DevTools Panel
Real-time request monitoring
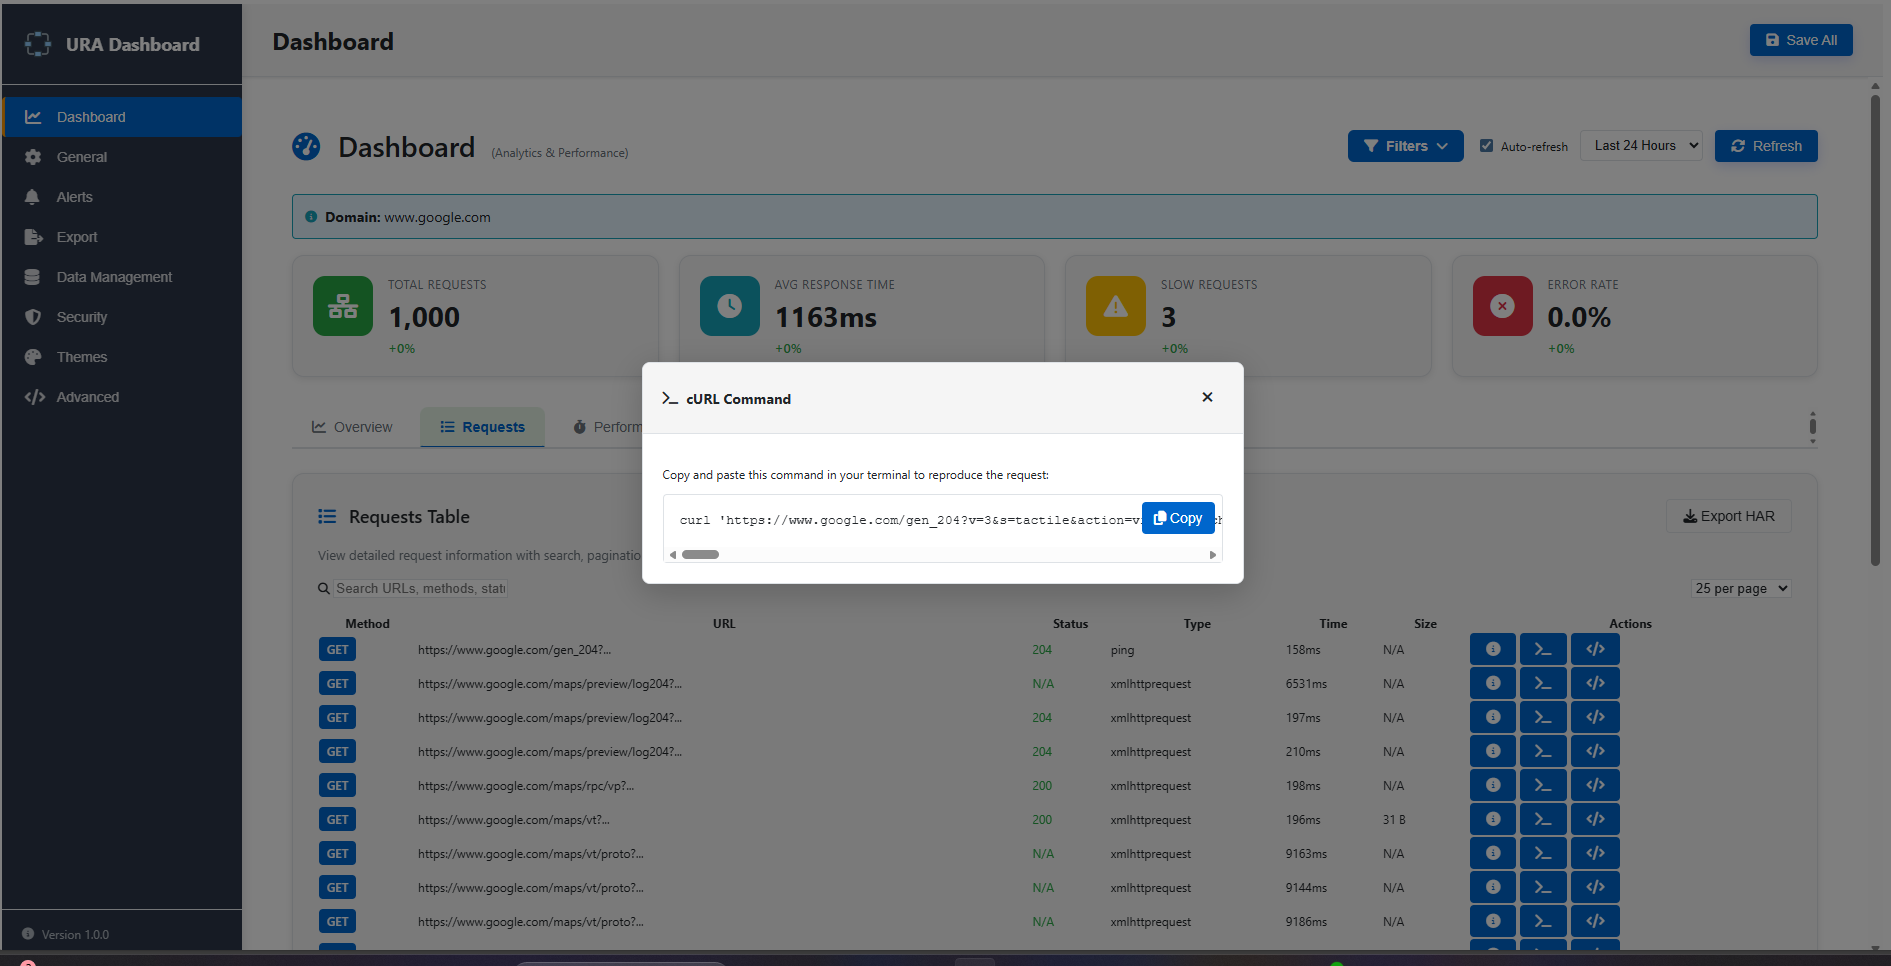
🔄 Export Actions
Copy as cURL or Fetch code
Everything you need for network debugging
Powerful features built for developers who debug APIs daily
Persistent SQLite Database
All requests stored locally. Data survives browser restarts. Query with raw SQL or use the dashboard.
Real-Time DevTools Panel
Integrated Chrome DevTools panel with filtering, waterfall visualization, and timing breakdown.
Performance Analytics
Plot individual request times at actual timestamps. Spot latency spikes and analyze patterns.
Export as cURL/Fetch
Copy requests as cURL commands or JavaScript Fetch. Variable substitution for API tokens.
Medallion Architecture
Bronze → Silver → Gold data layers for efficient analytics. Direct SQL query support.
Error Tracking
Automatic 4xx/5xx detection. Analyze error patterns and set up custom alerts.
Multiple Export Formats
Export as HAR, JSON, or CSV. Share data with your team or import into other tools.
Light & Dark Themes
Fully customizable with CSS variables. Respects your system preferences.
Built for real debugging scenarios
Built with modern web technologies
🚀 Get started in 30 seconds
- Download
ura.zipfrom the button above - Extract the archive to a folder
- Open Chrome →
chrome://extensions/ - Enable "Developer mode" (top right toggle)
- Click "Load unpacked" → select the extracted folder
- Browse any website → requests are captured automatically ✨
Access the extension:
- DevTools Panel: Press F12 → click "URA" tab
- Dashboard: Click extension icon → "Dashboard"
- Popup: Click extension icon for quick stats
Cross-browser compatibility
| Browser | Version | Status |
|---|---|---|
| Chrome | 88+ | ✅ Fully Supported |
| Edge | 88+ | ✅ Fully Supported |
| Firefox | 109+ | ✅ Fully Supported |
Documentation
MIT License · Open Source · Built for Developers